Bivouac
Taking a complex public-data product from research to a live service
A solo product design project, carried from field interviews to a live application mapping bivouac regulations across the French mountains. Institutional rules, computed data and field reports had to share one interface without cancelling each other out.
What I want you to take from this project
Three things, if you are deciding whether to talk to me.
I work where the model is the hard part
Bivouac looked like a map app. It turned out to be a question of who is allowed to state a rule.
I de-risk before engineering starts
A design-first POC changed the data model, the contribution rules and the governance approach before any production code existed.
I take projects all the way to production
The V1 is online and externally code-audited. It now supports talks with a national park, a federation and a département.
Project context
- Role
- Solo across the chain: user research, product strategy, information architecture, UI design, design system, prototyping, and the V1 build.
- Timeline
-
- 2018. Master's thesis. Field observation and interviews with mountain professionals.
- 2019 → 2024. Dormant. The gap between a static mockup and a working service was too wide to cross alone.
- 2025. Design-first POC in Figma Make, to test the product model.
- 2025 → 2026. V1 designed, built, code-audited, published. Association created, institutional outreach started.
- Tools
- Figma · Figma Make · Claude Code · Next.js · TypeScript · Supabase · OpenStreetMap and Overpass API · INPN protected areas · IGN BD TOPO
- Stakeholders involved
- Practitioners, land managers (parks and nature reserves), public authorities issuing local orders, national federations.
- Research partners
- PGHM Chamonix (mountain rescue) and ARVA (avalanche safety equipment), during the 2018 phase.
- Current status
- V1 online. Authentication, GDPR compliance and hosting remain before a full public opening. Talks under way with Parc national des Écrins, Conservatoire d'Espaces Naturels, FFRandonnée and Département de l'Isère.
The problem
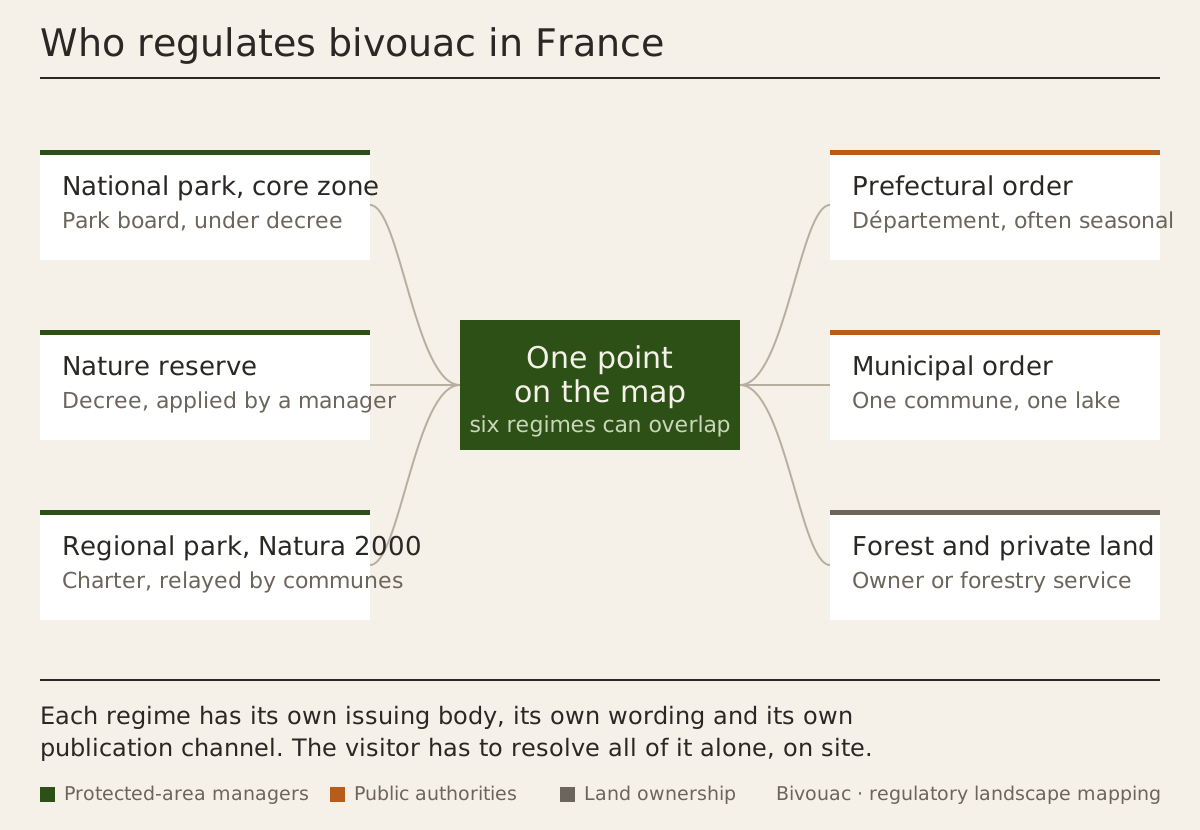
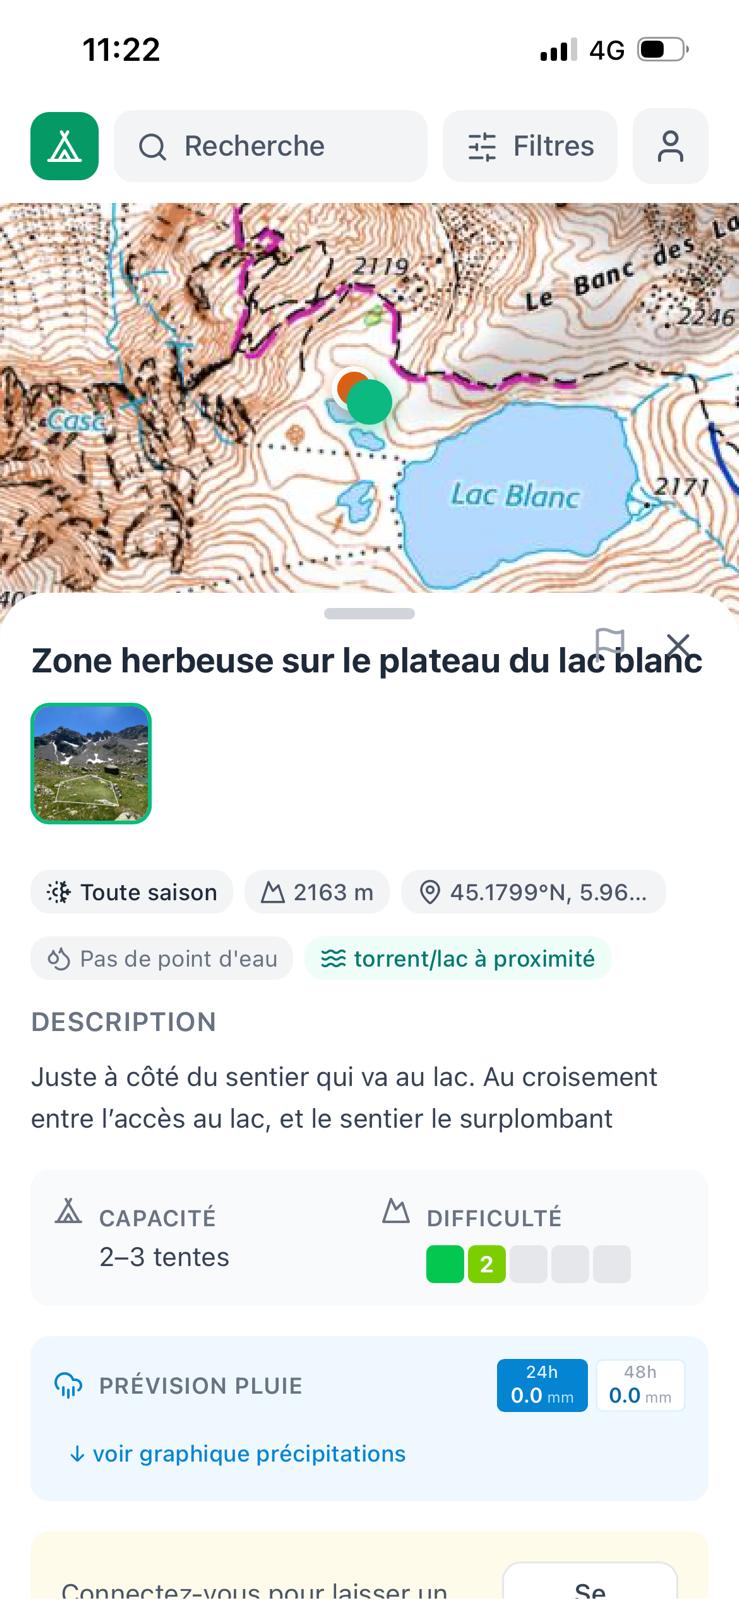
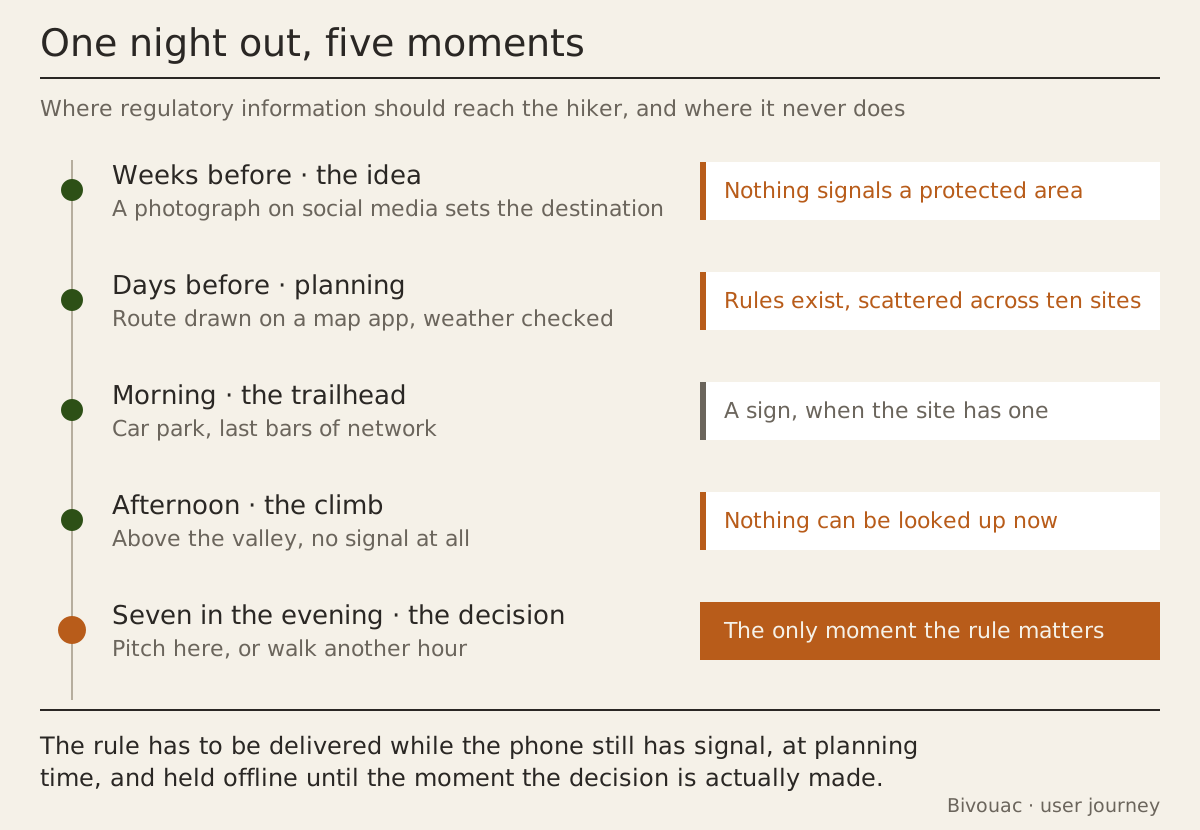
A hiker reaches a lake at seven in the evening, two hundred kilometres from home, and wants to know whether they can sleep there. The answer depends on which national park, nature reserve, prefectural order and municipal order overlap at that exact point, each published through its own channel, in its own wording.
So people go with what they saw on social media. Across the Alps, a handful of accessible, photogenic sites take far more visitors than they can hold. Land managers answer with quotas and bans, and ranking-driven apps keep sending traffic to exactly those places.
The brief I set myself: carry an existing rule to a non-local visitor at the moment they decide, and let the bodies who write those rules speak for themselves inside the product.
Research and field work
2018, how information fails. Field observation and semi-structured interviews, including PGHM Chamonix and ARVA. In the mountains, decisions run on habit and hearsay when the official rule never arrives in time.
"Regulations exist, and users still cannot find them in time. The problem is that they are scattered across dozens of jurisdictions with no consistent format."
Synthesised from field interviews, 2018
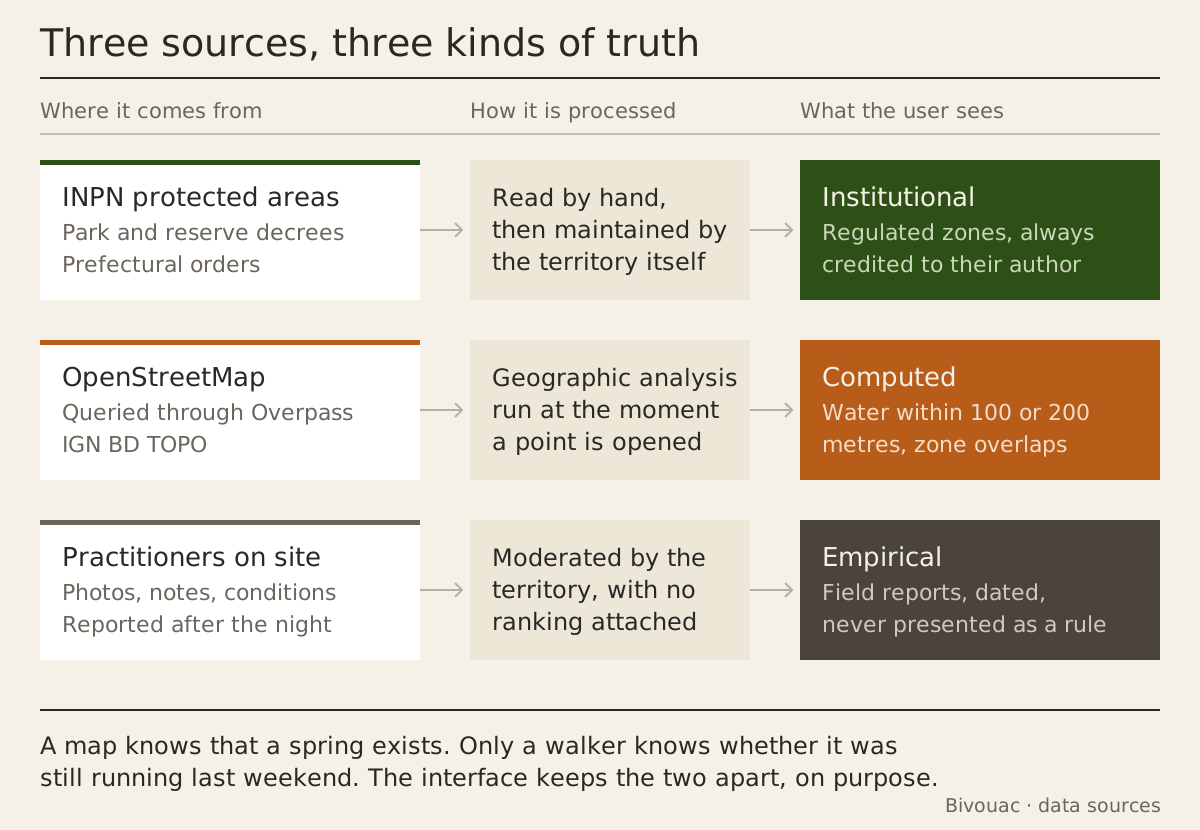
2025, how institutions work. I read prefectural orders, audited which public datasets exist and what they actually describe, and spoke with the people who write and enforce the rules. A platform that displays regulation inherits a question of authority, and the only workable answer was to let each land manager speak in their own name inside the tool.
Institutional data
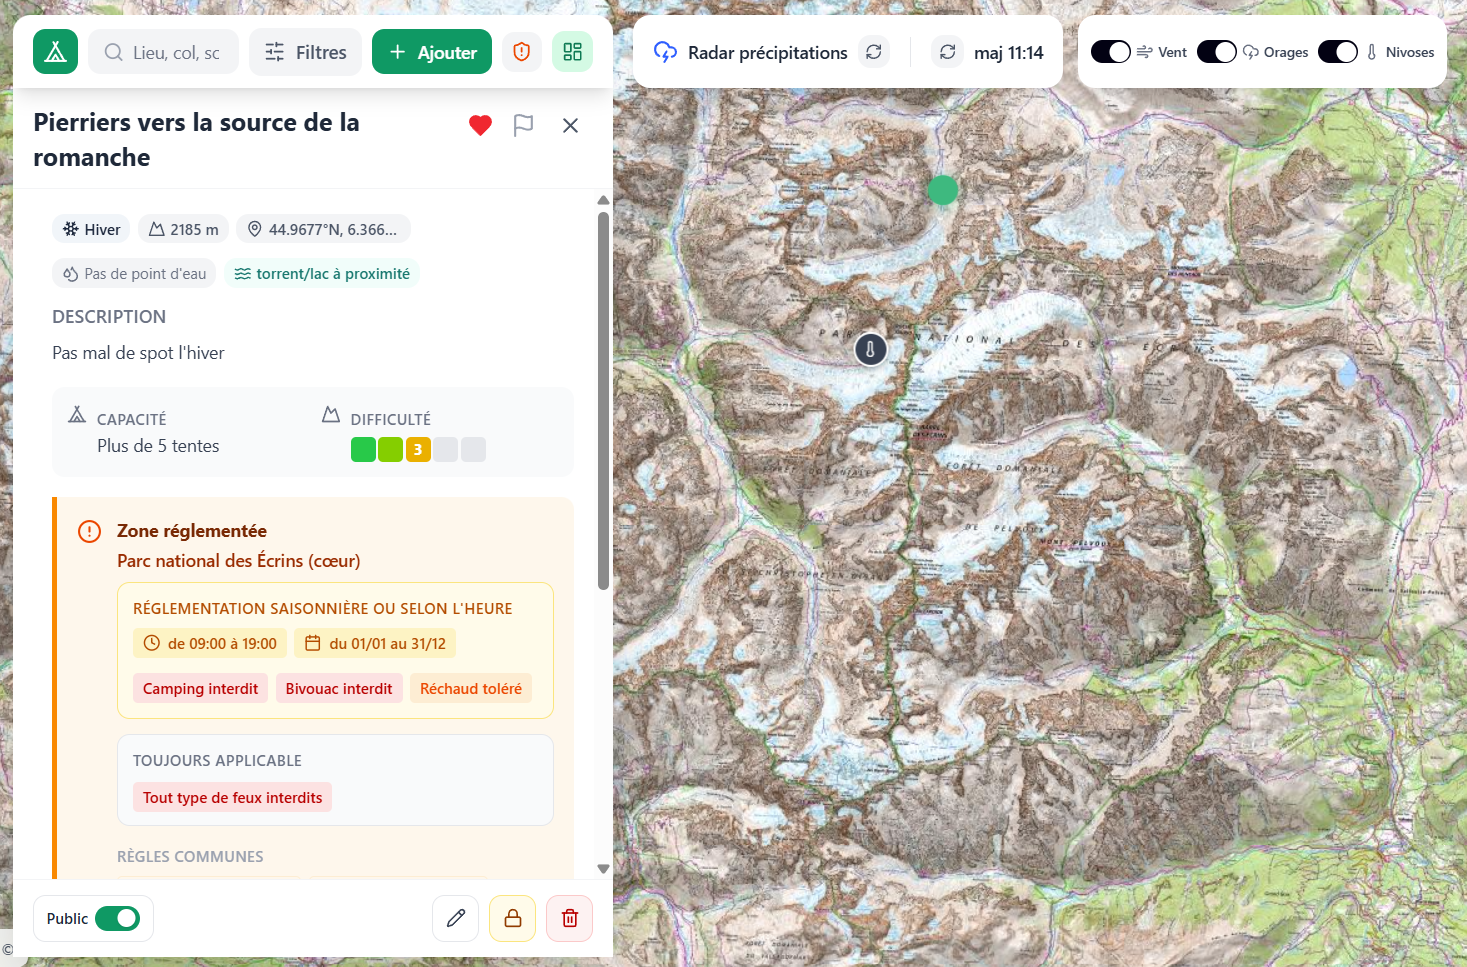
Regulated zones, protected areas, park boundaries. Carries authority, always credited to the body that issued it.
Computed data
Geographic analysis from open datasets: water within 100 or 200 metres, zone overlaps. Complete across the territory, and always theoretical.
Empirical data
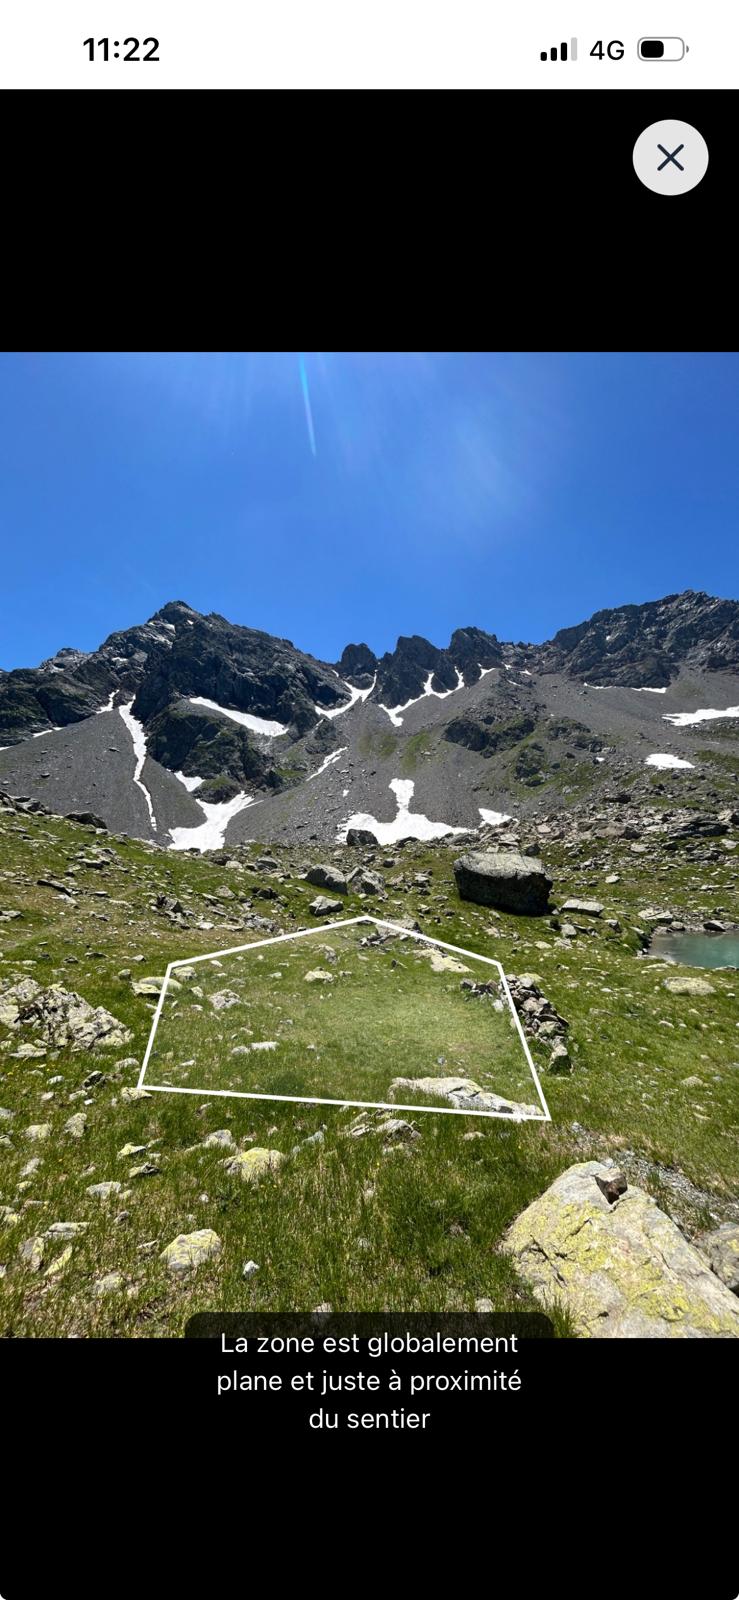
What a practitioner saw last weekend. Whether the spring was running, whether the ground was flat. Concrete, and always dated.
Design decisions
Each decision came from a tension that only appeared once the system ran, and each one has a cost I accepted.
Contribution without a leaderboard
Community reports stayed, because field knowledge has no substitute. Rankings, popularity scores and best-of lists came out. Practitioners document conditions; the product never promotes a destination.
Cost: slower growth, and no viral mechanic to lean on.
Regulation as a map layer, with its source attached
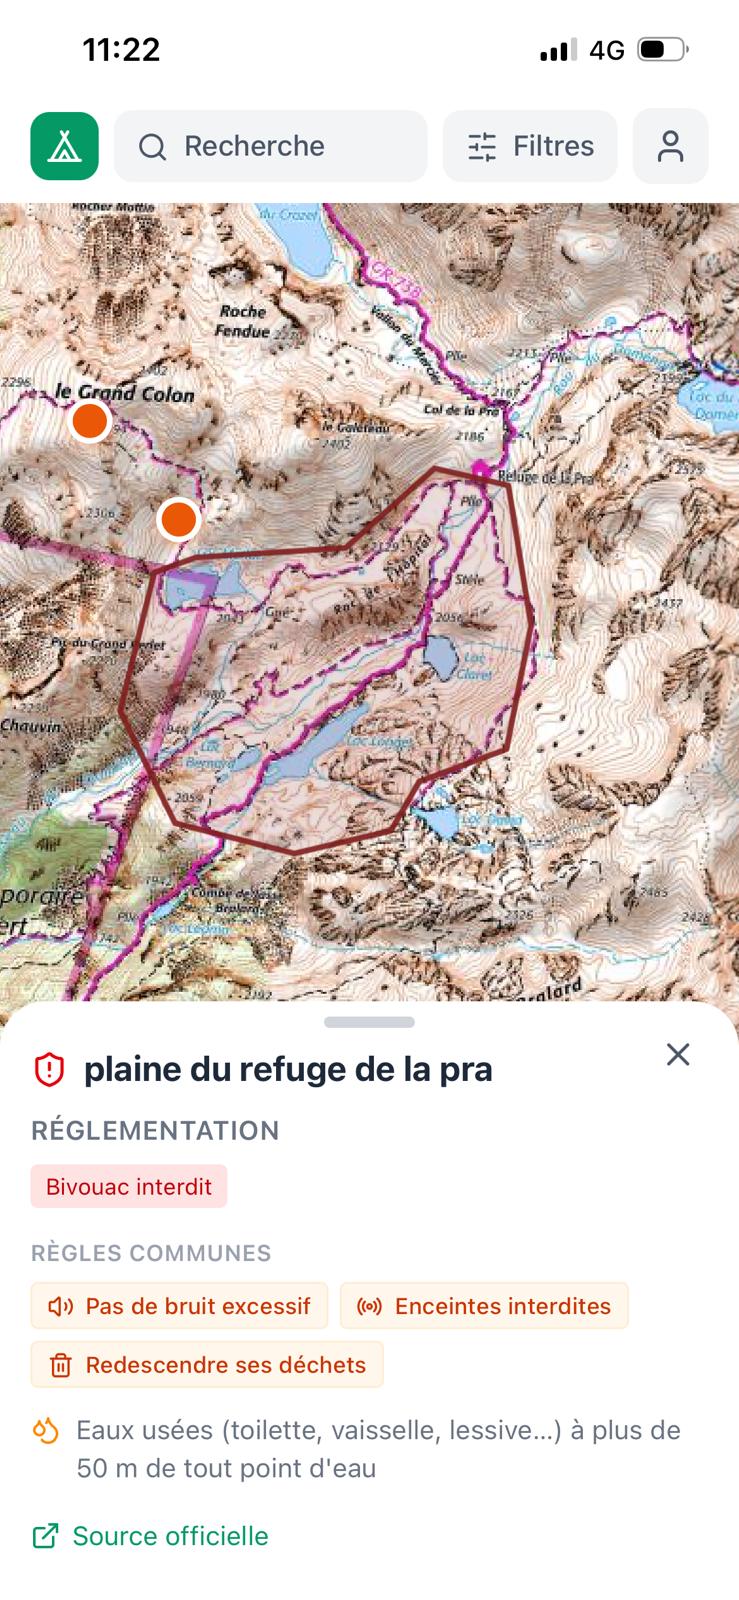
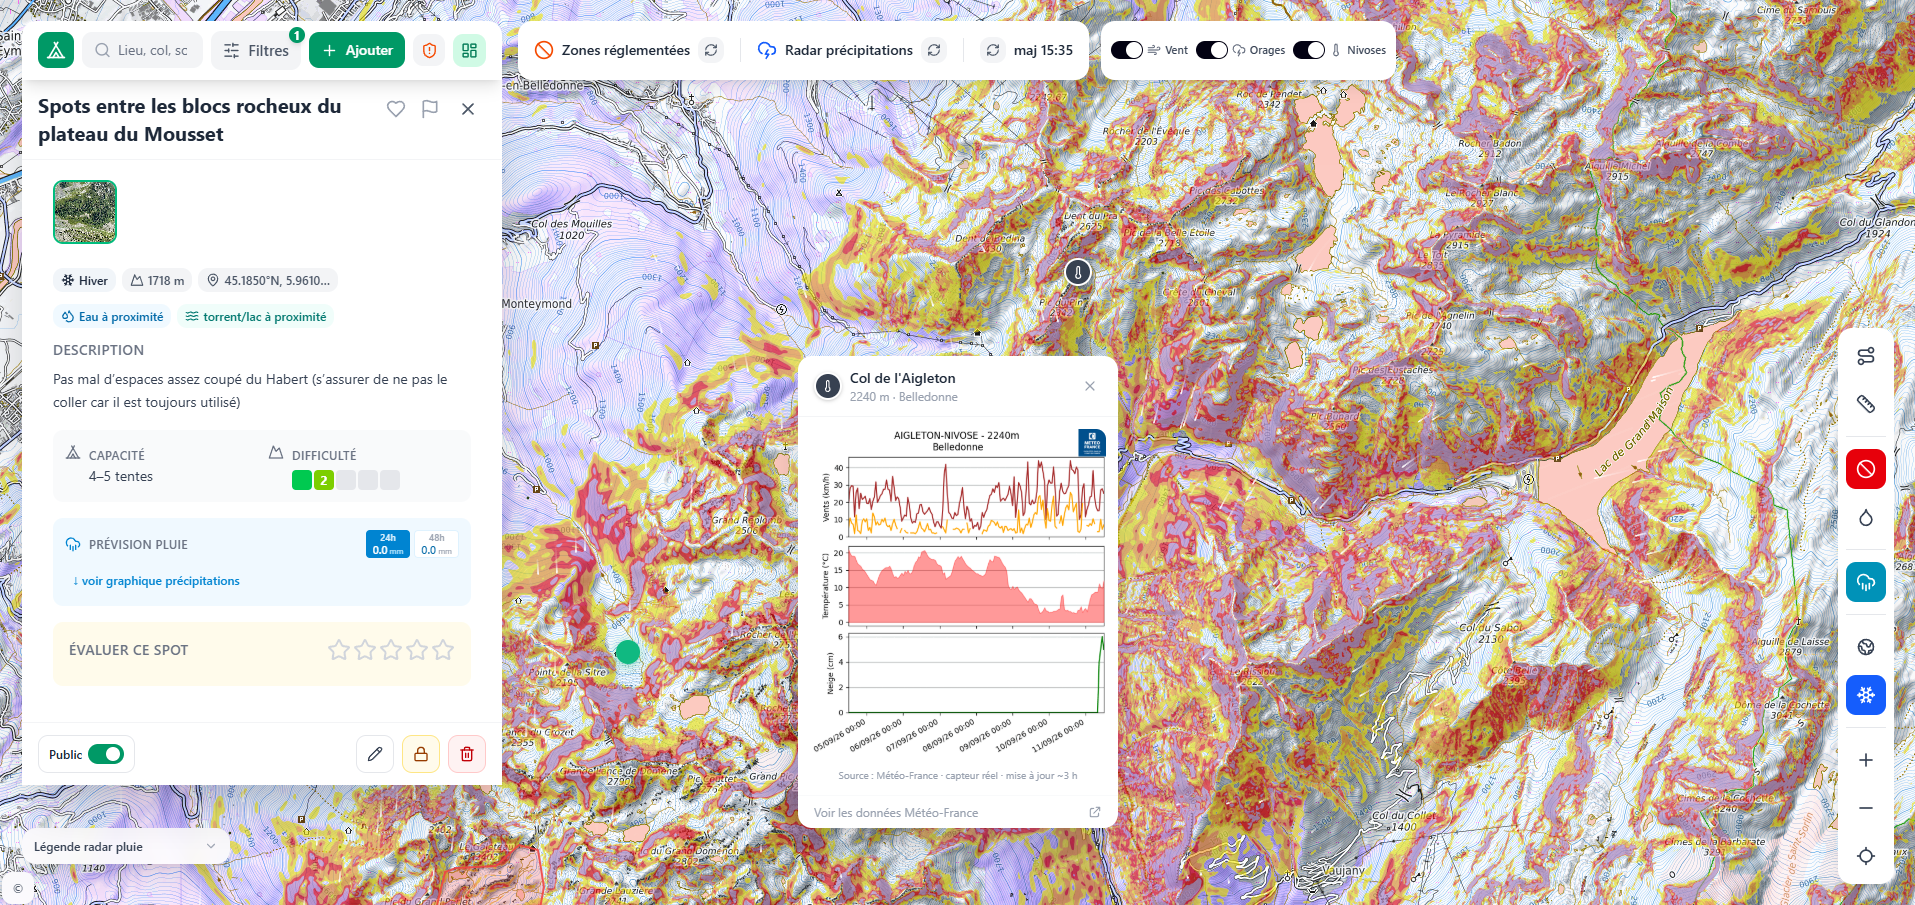
Every zone carries its issuing body, its restrictions and a link to the official text. Strict bans are drawn on the map; moderate regimes surface in the detail panel of the points inside them.
Cost: two levels of display logic to maintain, and a harder first read of the map.
Computed where it helps, human where it matters
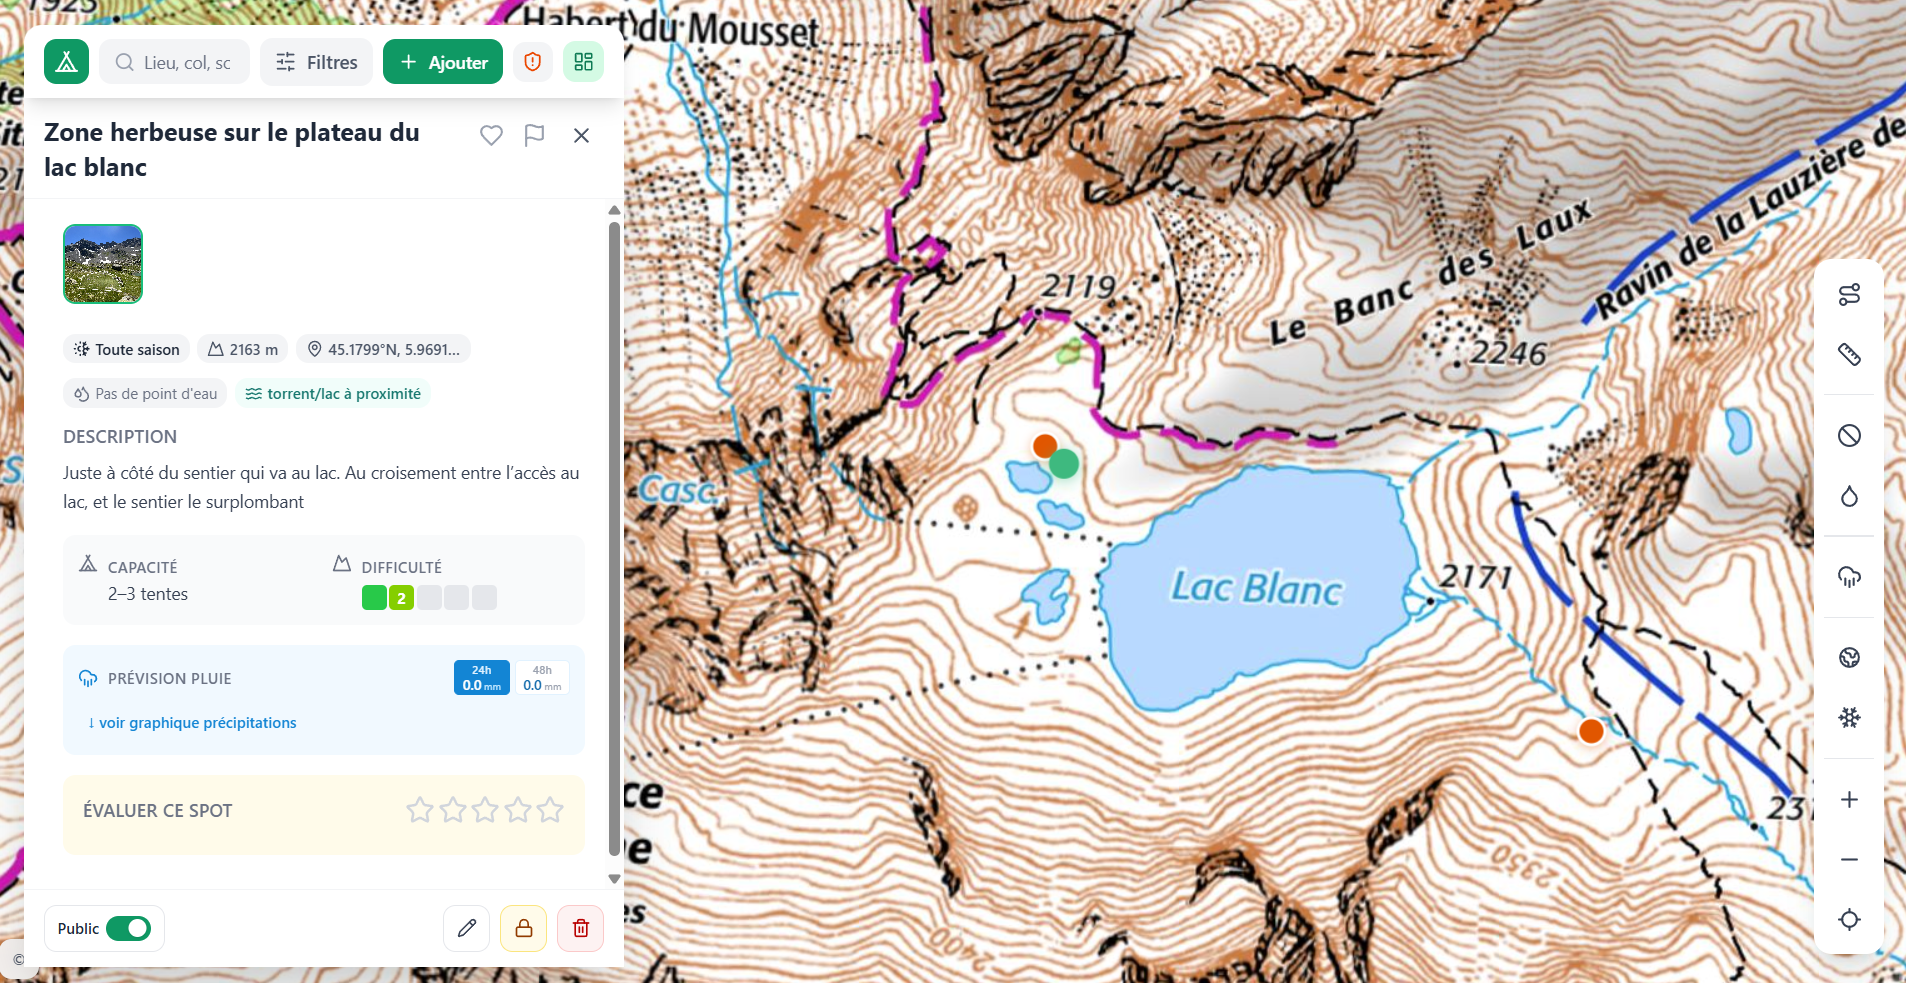
Open data derives water proximity, so nobody reports it. A map knows a spring exists; only a person knows it was still running. Both are shown, each labelled.
Cost: more interface work to keep the distinction legible without jargon.
Territories administer their own zones
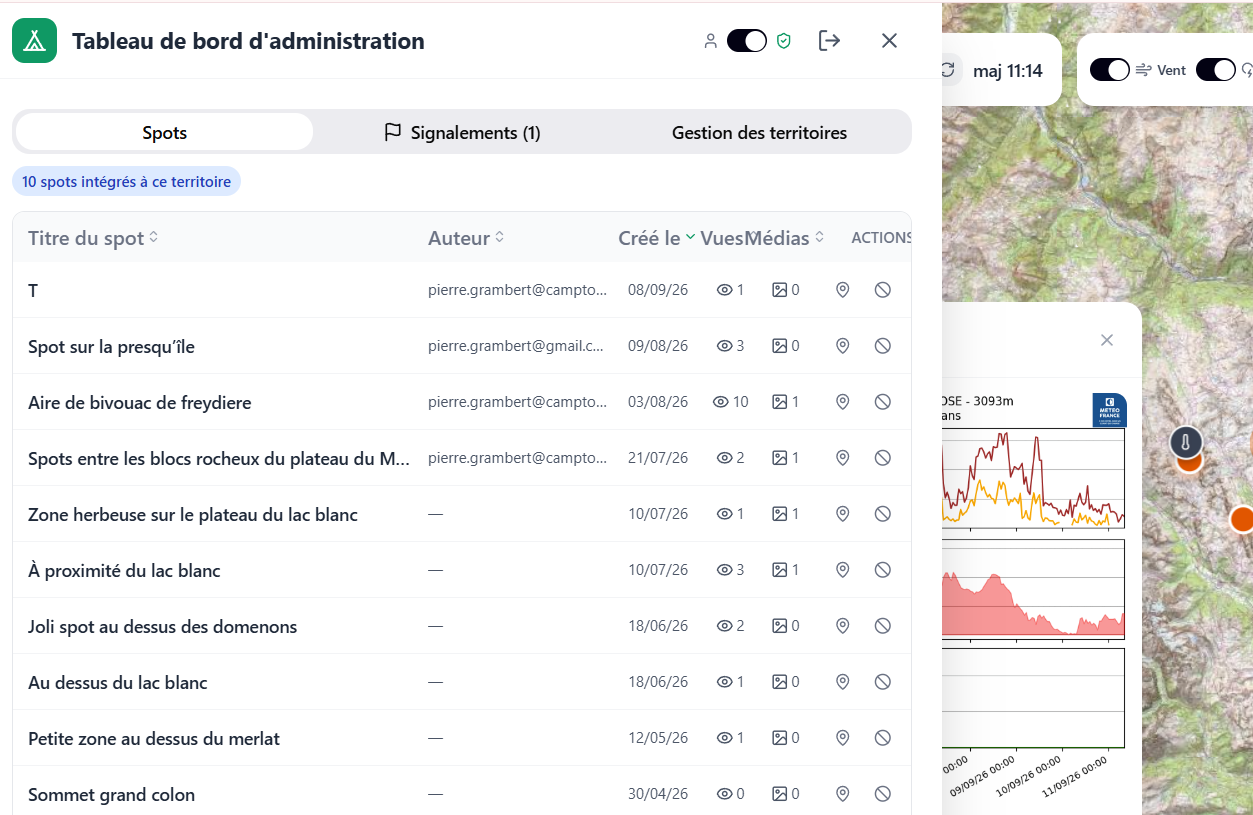
A park, a resort or an intercommunality moderates the points on its territory, draws its perimeters and states what is tolerated. This is what makes the product institutionally acceptable.
Cost: a second product surface to maintain, and a partnership process before any territory joins.
Educational orientation, never authorisation
The product helps someone decide and stops short of granting permission. That line runs through the wording of every regulatory card; checking conditions on site stays with the user.
Cost: copy that has to stay precise, reviewed line by line.
Process: from design-first POC to a live V1
The 2018 thesis produced solid framing and a design that only lived on paper. What changed in 2025 is tooling: AI-assisted prototyping made it realistic to build something dynamic enough to hold real data and real interactions, without committing to a full development effort first.
The POC earned its keep. It turned water reporting into computed data, separated the three families of information, and surfaced the governance question that eight years of static mockups had kept hidden.
The V1 is a real application: Next.js and TypeScript, Supabase for data and edge functions, OpenStreetMap and INPN as sources, and a completed external code audit. Authentication, GDPR compliance and hosting sit between that and a full launch.
Design, exploratory prototype, clarified model, then development. Moving uncertainty earlier is cheaper than finding it mid-sprint, and it lets a proof of concept answer more than technical feasibility: whether the system it proposes deserves to exist.
Outcome and reflections
Bivouac is live online under a non-profit association, so regulatory information stays free to access. Talks are open with a national park, a conservatory of natural areas, a national federation and a département, and a first funding application is in.
What this project sharpened in my practiceProducts that display public information are governance objects first. Most of the work went into deciding who is allowed to say what, which transfers to any domain with institutional stakeholders.
Naming the nature of each piece of data beat any feature prioritisation exercise. It gave a team of one a rule for settling conflicts, and gave institutional contacts a reason to trust the display.
National scope worked as a constraint, not an ambition. Community knowledge only becomes credible when the map stops at no arbitrary boundary, which is why I turned down the safer pilot-territory framing.
What I would do differentlyStart the institutional conversations earlier. I rebuilt the governance model from documents before talking to the people concerned, and a few of those exchanges would have saved months of hypothesis.